Two weeks ago, I finished fixing my biggest personal complaints about my lighting and editing. My biggest criticism of myself was that my pictures didn’t have as smooth and luxurious a skin tone as I wanted. I felt like I needed to add way too much saturation to get the results I wanted, and in that process the skin wasn’t as uniform as I wanted without retouching. It took a VERY long time to achieve the results I wanted. I learned that to get the improvements that I wanted, I needed to fundamentally understand how humans interpret light more than to become a better photo editor. I measured ten portraits from my latest work. Nine were still unretouched. These photos were already on my phone before I even thought to do this comparison. They are completely random photos taken out of my clients’ Dropbox folders simply because I wanted to put them all side by side to see what they’d look like as a group. When I finally did see them all together, it felt like my work had been refined better than I’ve ever seen it, by a good margin. I’ve always had people tell me that my photos were extremely natural and more pure to life. When I was fixing things; I got the impression that a lot of what I did probably just hasn’t been done before in the acting headshot market. I was very curious where I stood against all of the most renowned headshot studios in LA, the US and in the world’s biggest markets. These are the preliminary results.
I compared 10 pictures from my website with other photographers’ portfolios. We’d all picked work we wanted an actor to judge us by. I compared my latest work separately. Across 61 portfolios in seven cities, it stood out for how little the strength of the cheek color changed. My website still had the edge on a different question. From one photo to the next, did the color lean a little further toward pink or toward gold?
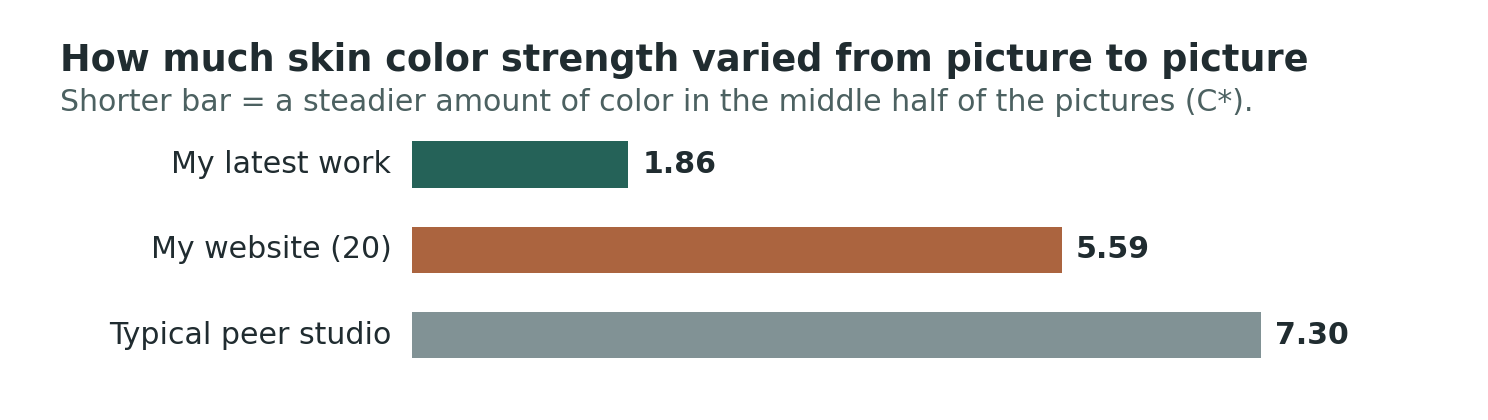
Read the bars as the amount of change you’d see scrolling through the pictures. My short green bar means the cheeks stayed close in color strength. Different actors could still look pinker, more golden, lighter or darker than one another.
What I measured on each face
Think about putting on blush. Choose a rose blush instead of a peach one and you’ve changed the hue, the family the color belongs to. Put on a little more of the same rose blush and you’ve increased its chroma, or how strongly that color shows up. Now turn your face toward a window. The brighter cheek has changed in lightness. A pale pink and a vivid pink can have much the same hue. And the shaded side of a face can still be quite colorful.
The measurements use a color wheel for hue, so differences are in degrees (°). Two readings close together on that wheel mean similar color. Chroma (saturation/vividness) is measured in units called C*. Zero is gray, and higher values mean stronger color. Lightness runs from black at 0 to white at 100, in units called L*. These are three things you can see in a picture. There’s no prize for getting the highest number in any of them.
With AI assistance, I sampled two small circles high on each face. Their size scaled with the distance between the eyes so a close crop wouldn’t get a larger piece of cheek. The spots were checked for hair and glasses. Comparing them separately showed whether one side of that person’s face looked different from the other.
I used the median to describe a typical picture. Line the ten portraits up from weakest cheek color to strongest. The median is halfway between the first and last readings. To measure spread, set aside the lowest quarter and the highest quarter and measure the width of the middle half. Say one gallery’s middle half runs from 20 to 22 and another’s runs from 15 to 27. Both could have a median of 21. The first has a spread of 2, the second a spread of 12. The first gallery holds color strength steadier. Either could still have one spectacularly red cheek at the far end.
I started with 317 portraits from 20 US portfolios in six cities, then looked closer to home at 351 pictures from 22 LA studios. Some studios were in both groups. Counting each studio once gave me 36 US portfolios and 573 portraits. I summarized each studio first so a photographer with a bigger gallery didn’t get extra votes.
Public actor recommendations, referrals and work with acting programs helped identify ten more New York photographers and fifteen in London. Sixteen pictures from each added 400 portraits. The same cheek measurements let me compare all seven cities. They tell me what the camera and edit delivered. Without a reference photographed beside each actor, I can’t tell how closely a given file matched the person on shoot day.
The color was ordinary. The consistency surprised me.
Croma consistency was by far my strongest performance metric. Meaning; my work had the most consistent saturation levels- you’d experience the smallest chance to your images being too saturated or muted as compared to my portfolio out of any studio measured if you’re looking at my latest work.
The median cheek chroma in my latest work was 21.64 C*. For a typical LA studio it was 21.75. In everyday terms, a typical cheek in my pictures looked about as vivid as a typical cheek in those LA portfolios. Simplified, this means that if you take all the saturation of all the best photographers in LA and find an average, just editing by eye, my work came REALLY close to the average. It didn’t lean too muted or too vivid. Just right.
How much did cheek color strength vary as the comparison grew? Simplified- how much did vividness/saturation levels vary within a photographer’s own portfolio?
First US sample · 20 peers — peer portraits 317, typical spread 7.78 C*, my latest work 1 of 21, website rank 2 of 21. Keep in mind the terminology: my “website” images were sampled randomly from the portfolio on my website, NOT my latest work.
LA only comparison · 22 — peer portraits 351, typical spread 7.27 C*, my latest work 1 of 23, website rank 5 of 23. LA overall performed better than the US average. I’m not surprised, LA has incredible talent.
Combined US · 36 — peer portraits 573, typical spread 7.60 C*, my latest work 1 of 37, website rank 6 of 37.
US with NYC additions · 46 — peer portraits 733, typical spread 7.71 C*, my latest work still 1 of 47, website rank 8 of 47.
US and London · 61 — peer portraits 973, typical spread 7.30 C*, my latest work once again still 1 of 62, website rank 13 of 62. 13 of 62 was not bad for something I wasn’t satisfied about.
Shorter spreads mean less change in color strength from picture to picture. In the LA row, my latest work had the smallest spread of 23 entries. My website, ranked separately against those same studios, came fifth. The groups in successive rows overlap.
Now look at the width of the middle half. My latest work covered 1.86 C*. The typical LA portfolio covered 7.27, nearly four times as much. Another LA photographer even had the same typical color strength as I did, 21.64, while their spread was 4.59. Imagine two galleries with an equally rosy picture in the middle. Scroll through one and the surrounding faces stay close to it in color strength. Scroll through the other and you see more muted cheeks and more vivid ones. That’s what the spread picks up.
Across all seven cities the typical studio also landed at 21.64 C*. My latest work had a narrower spread than even the tightest peer portfolio, at 3.43. My website’s spread was 5.59 all along. Its rank moved from sixth against 36 US peers to eighth after adding New York, then thirteenth after adding London. Same website photos. Two of the added New York portfolios and five in London simply had a narrower range.
Counter argument
Obviously, this penalizes photographers who have more saturation variance in their work. You can make the argument that they made more creative choices in their editing. My counter to this is that headshots should be natural and consistent and show true-to-life colors. I don’t think oversaturating or muting someone’s skin are the best “creative” choices for headshots. Looking at individual portraits sampled, the biggest offenders were neon-looking skin that I do not think was a creative choice.
My latest work alongside every LA studio
I wanted to see every studio because a single LA midpoint hides a lot. Here each gray row is a different portfolio. The green diamond marks my latest work, the rust square is my website, and the dashed line marks the middle LA studio value. Each of my samples is ranked against the same 22 studios. They don’t compete with each other. The anonymous studio numbers stay the same from chart to chart.
Counter argument
You are about to see some data that points to my studio looking dramatically better than peers, which is easy to be skeptical about. You can argue that it is an unfair comparison because I’m only sampling recent work. My counter to this is that editing is actually harder right now because my eyes are still adjusting to a new editing style. As you’ll see further on- my latest work actually performed slightly worse as compared to my older work on hue variance for that exact reason. I can say firsthand that after the changes I’ve made, I’m not changing my saturation levels much at all anymore because the photos are looking more like how I want right out of camera. I think that’s what is showing up here.
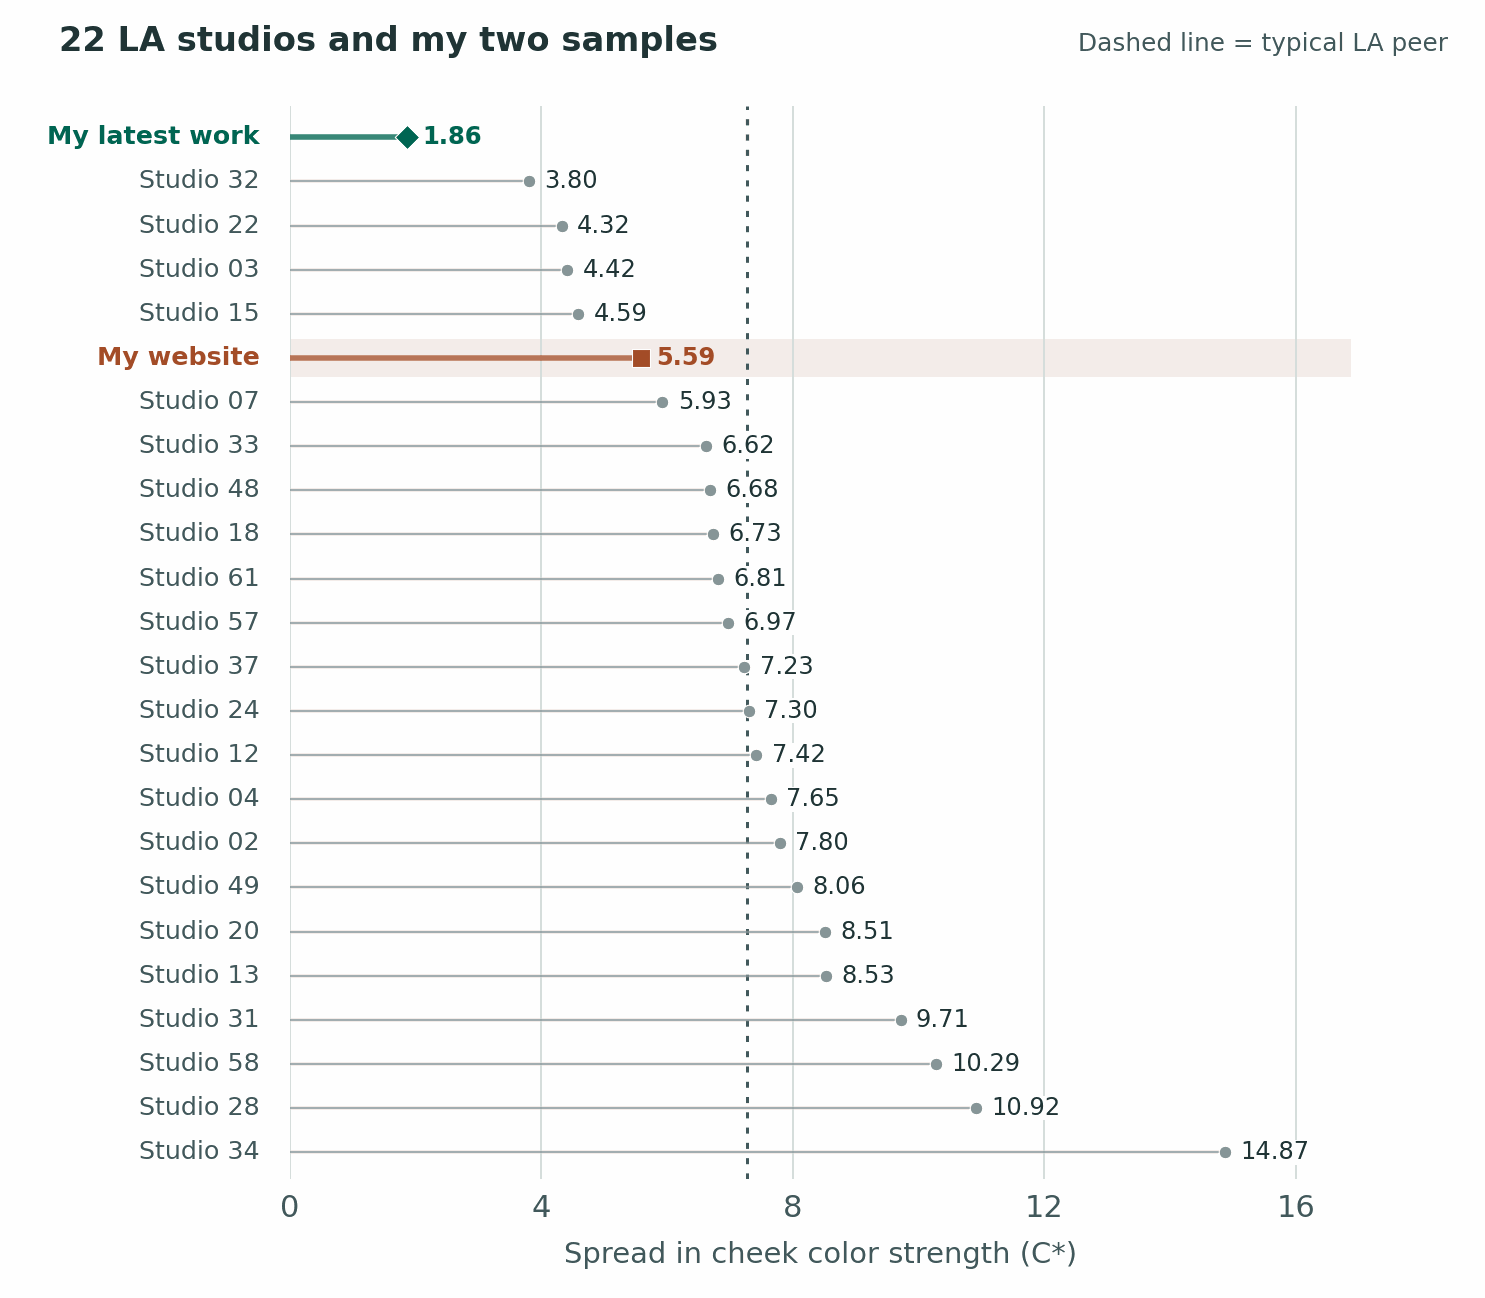
Start at the green diamond. My middle pictures span 1.86 color-strength units. The next studio comes in at 3.80. Even that studio has a little over twice as much room between its more muted and more vivid cheeks. Look at my website and four LA studios sit to its left. That’s the distinction between an encouraging early result and the work you could actually judge me on before booking.
My latest work compared across seven cities
What happens if home is an unusually easy comparison? I put every studio on one scale and grouped them by city. Each dot represents a whole portfolio. A dot further right means its middle portraits varied more in how strongly colored the cheeks looked. The two vertical lines stay put because my pictures stay the same.
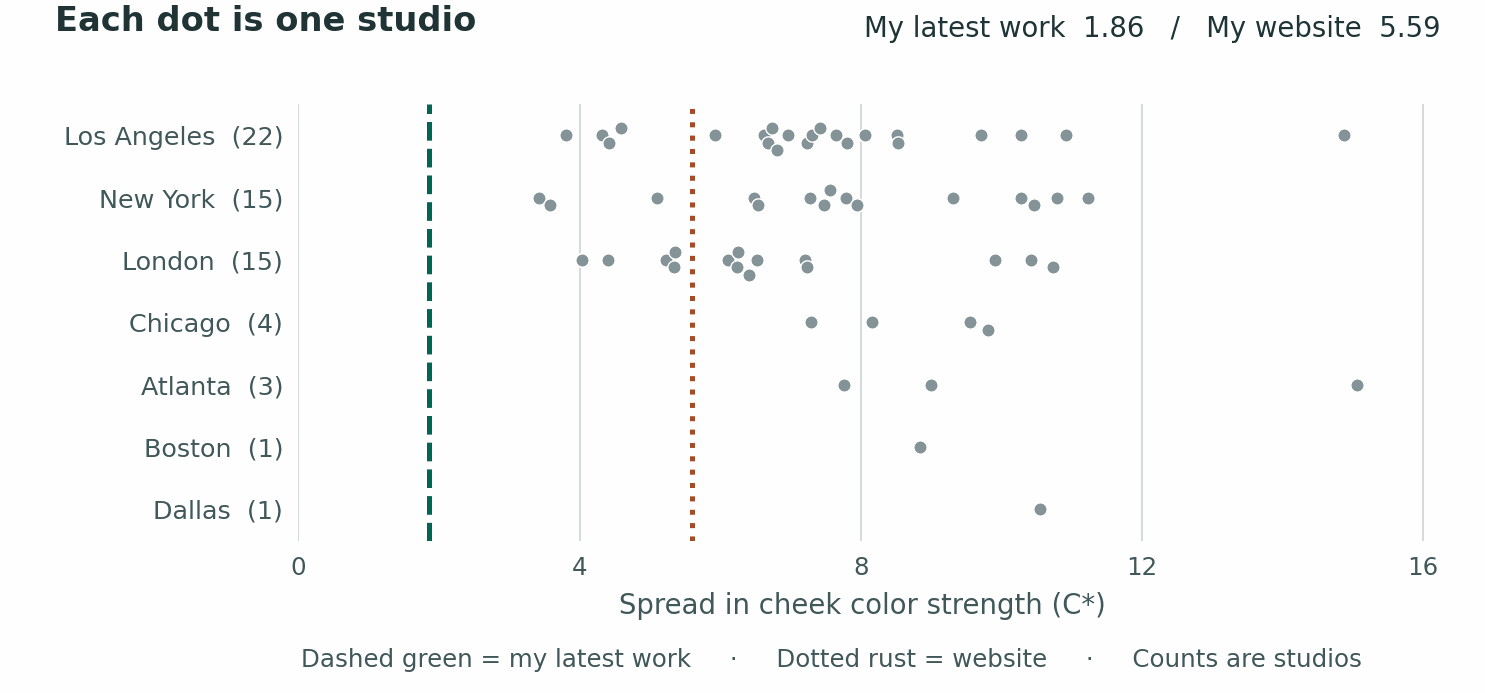
In this sampling pass every peer dot falls to the right of the line for my latest work. The nearest is at 3.43 C*. The typical peer is at 7.30. That makes the preliminary result unusual even among working photographers outside LA. The website line runs right through the other portfolios. A fair number of studios also deliver steady color.
My website had the steadier hue
As previously mentioned, I would have bet on my latest work for steadier hue. I’d have lost. Line my website portraits up from the redder cheeks toward the yellower ones and the middle half spans 3.78° on the color wheel. My latest work spans 4.32°, and the typical LA studio spans 7.58°. As you scroll, my website wanders the least of those three in how pink or golden the skin looks. My latest work holds the strength of that color steadier.
Where skin color landed and how much it moved.
Typical hue (°) — website (20) 52.44, my latest work 53.57, typical la 52.38.
Hue spread (°) — website (20) 3.78, my latest work 4.32, typical la 7.58.
Typical color strength (C*) — website (20) 23.20, my latest work 21.64, typical la 21.75.
Color strength spread (C*) — website (20) 5.59, my latest work 1.86, typical la 7.27.
Interpretation: my previous work was closer to the median and had less hue variation. My latest batch is now a little warmer than median (by design, thats what I wanted) and a slight bit more hue variation. This will improve as I get more accustomed to the new style of editing.
Against all 61 peers, my website came second for steadiness of hue and my latest work came fifth. The Dallas example shows why hue and chroma deserve separate columns. That one portfolio held the pink-to-gold direction a little steadier than my latest work, while its range of color strength was over five times as wide. A person can stay pink in both pictures and look a great deal rosier in one.
How widely the typical portfolio varied in each city
Los Angeles — studios 22, portraits 351, hue spread 7.58°, color strength spread 7.27 C*.
New York — studios 15, portraits 240, hue spread 10.62°, color strength spread 7.56 C*.
London — studios 15, portraits 240, hue spread 9.45°, color strength spread 6.26 C*.
Chicago — studios 4, portraits 62, hue spread 10.81°, color strength spread 8.85 C*.
Atlanta — studios 3, portraits 48, hue spread 13.87°, color strength spread 9.00 C*.
Boston — studios 1, portraits 16, hue spread 9.05°, color strength spread 8.85 C*.
Dallas — studios 1, portraits 16, hue spread 4.21°, color strength spread 10.56 C*.
I still think my new lighting is an improvement. My eye needs time with it, especially when I’ve just edited one actor and start on another. The hue result gives me a precise thing to look for when that second file opens.
Who held hue steady from actor to actor?
The last charts tracked how strong the color looked. This time imagine scrolling through face after face and watching for a swing from peach toward pink. The farther right a point sits, the more that color direction moved within the middle half of one photographer’s portraits.
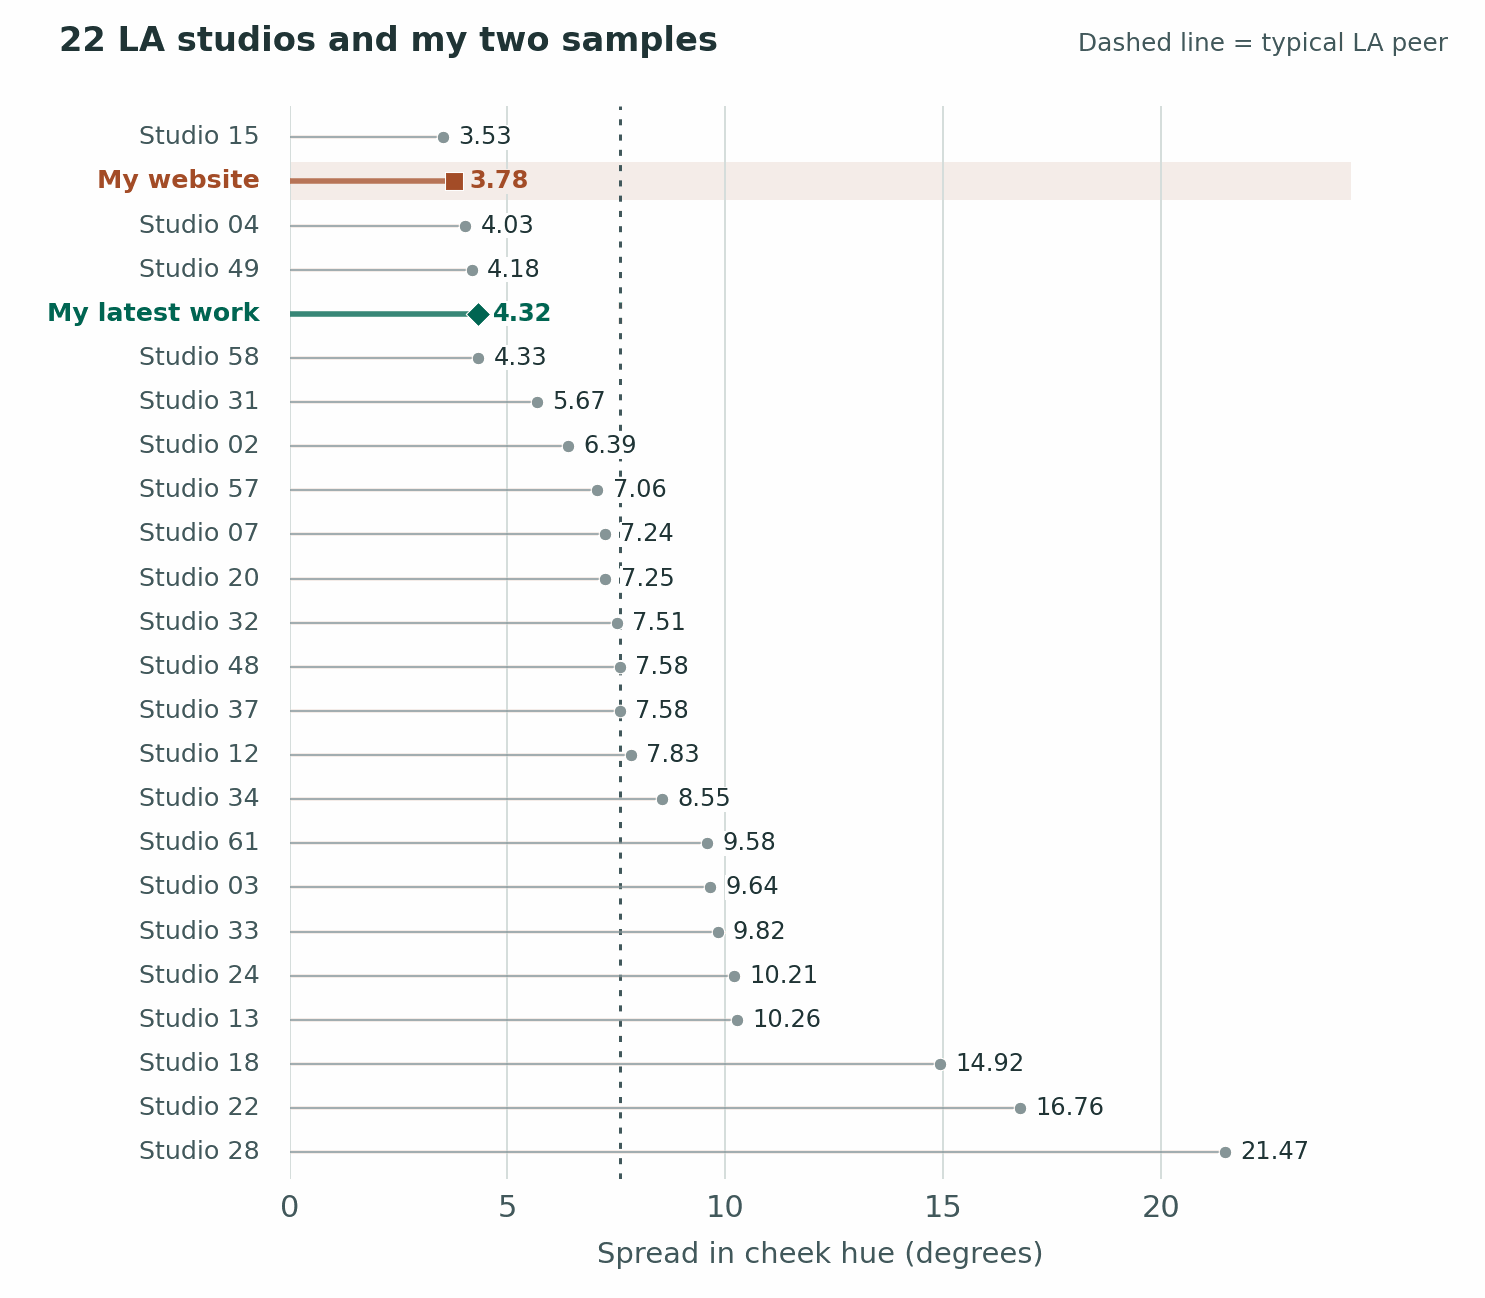
This time my website sits above my latest work. Only one LA portfolio had a narrower spread than my website’s 3.78°. Three had a narrower spread than my latest work at 4.32°
How hue consistency traveled
Here is an alternative graphic with studios divided into regions. Every dot below uses the same degree scale as the previous chart.
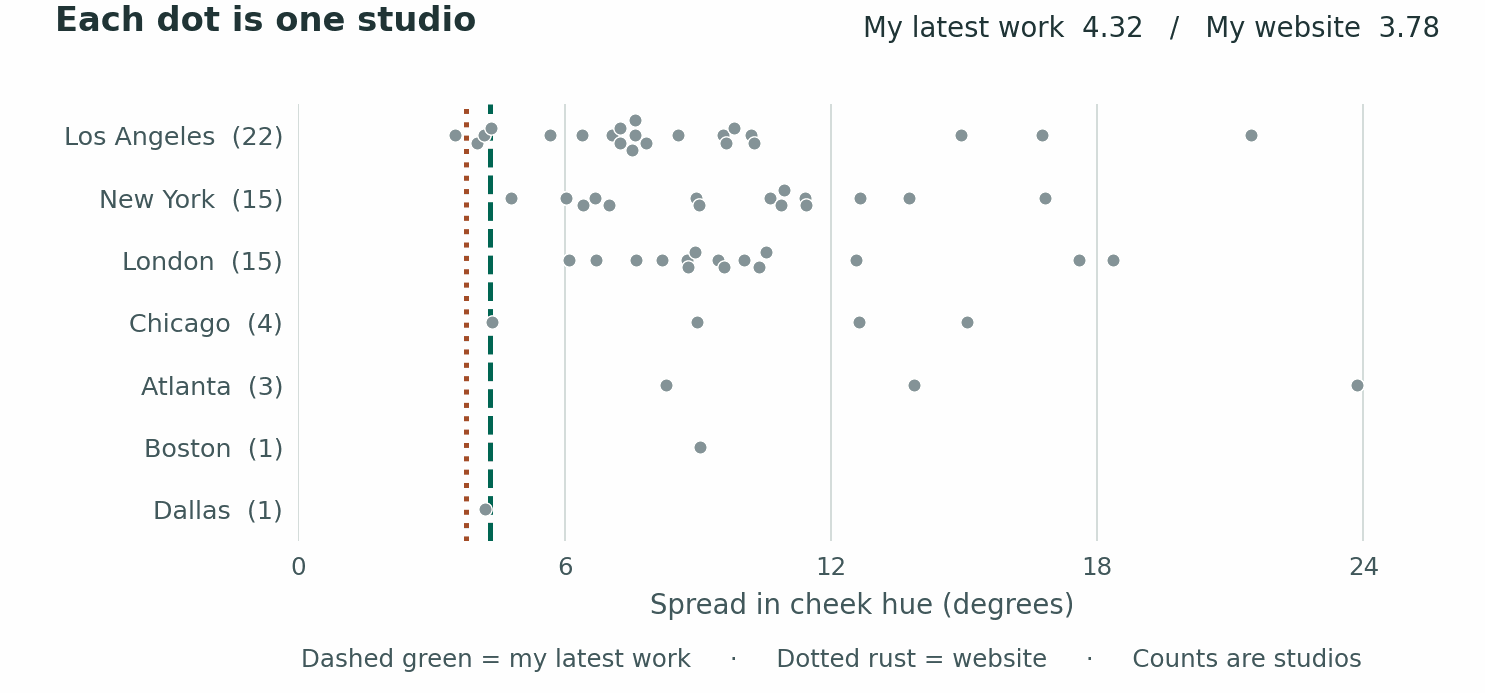
The green line for my latest work is left of every New York and London dot. In LA, three studios beat it, one in Dallas. That studio measured 4.21°, just inside my 4.32°.
Across the whole group my website ranked second and my latest work fifth, separately. For an actor browsing galleries, this means both sets tended to hold to a narrower band of skin hues than most of what I sampled. You still want to find pictures of people who actually look like you. A narrow band can come from who’s in the gallery as well as how the pictures were made.
Which way did the typical cheek color lean
Now the horizontal axis means something different. This chart places each studio’s typical cheek color on the color wheel. Within the range of these portraits, moving left means a redder hue. Moving right means a yellower hue. A studio can live near either end and be very consistent there. You are not looking for a smaller number here; this is simply plotting where the hue lands on the median. This is a really cool chart because you can look at this and see if each studio as a warm or cool rendering. I could NOT believe that my website landed firmly on the median for hue as well. That was not intentional at all. My previous shots were just not too warm, cool, green, or purple compared to other studios. I do want them to be a little warm, as you can see in my latest work.
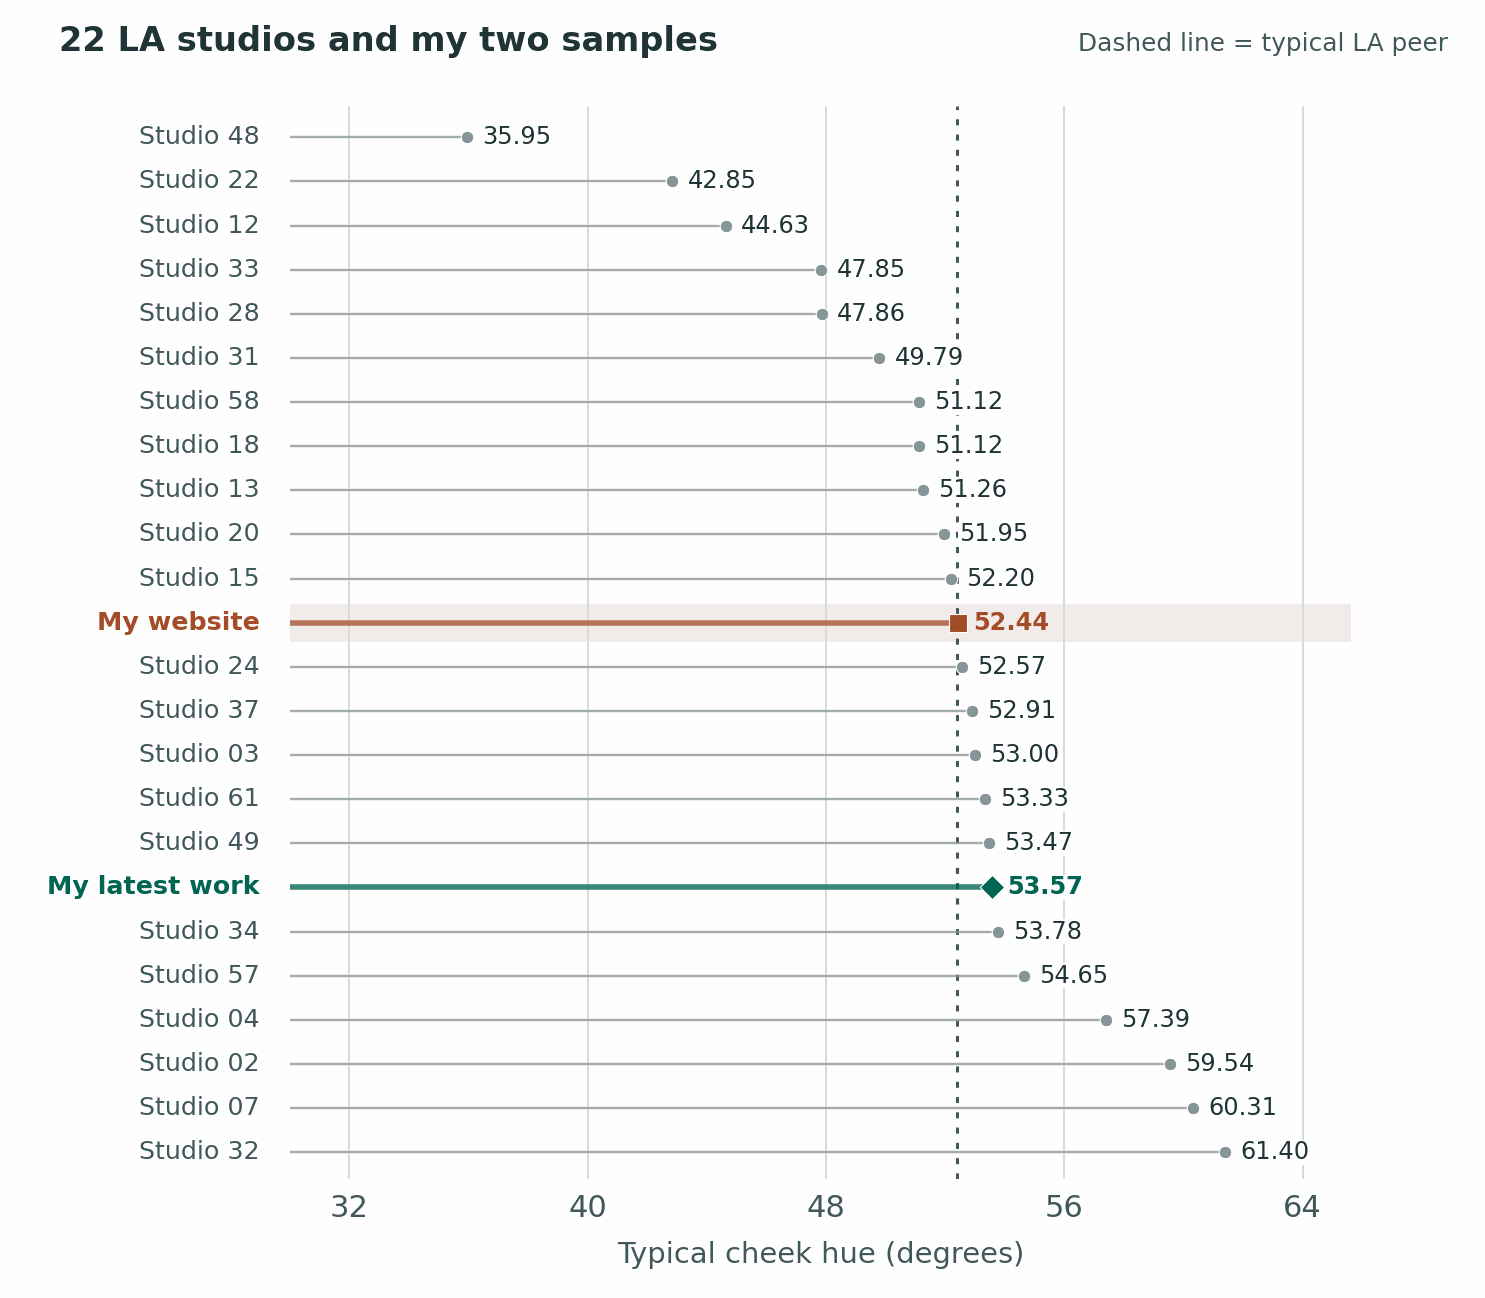
My website sits at 52.44°, six hundredths of a degree from the LA midpoint of 52.38°. My latest work lands a little further toward yellow at 53.57°. Those are close neighbors on a wheel.
How vivid the typical cheeks looked
This graph demonstrates the same thing for color chroma. Further right means the color generally came through more strongly. We see the opposite result now, where my latest work sits RIGHT on the median. This is absolutely where I want to be; I don’t want images to be too saturated or not saturated enough. My older work came in slightly more saturated as compared to peers in LA.
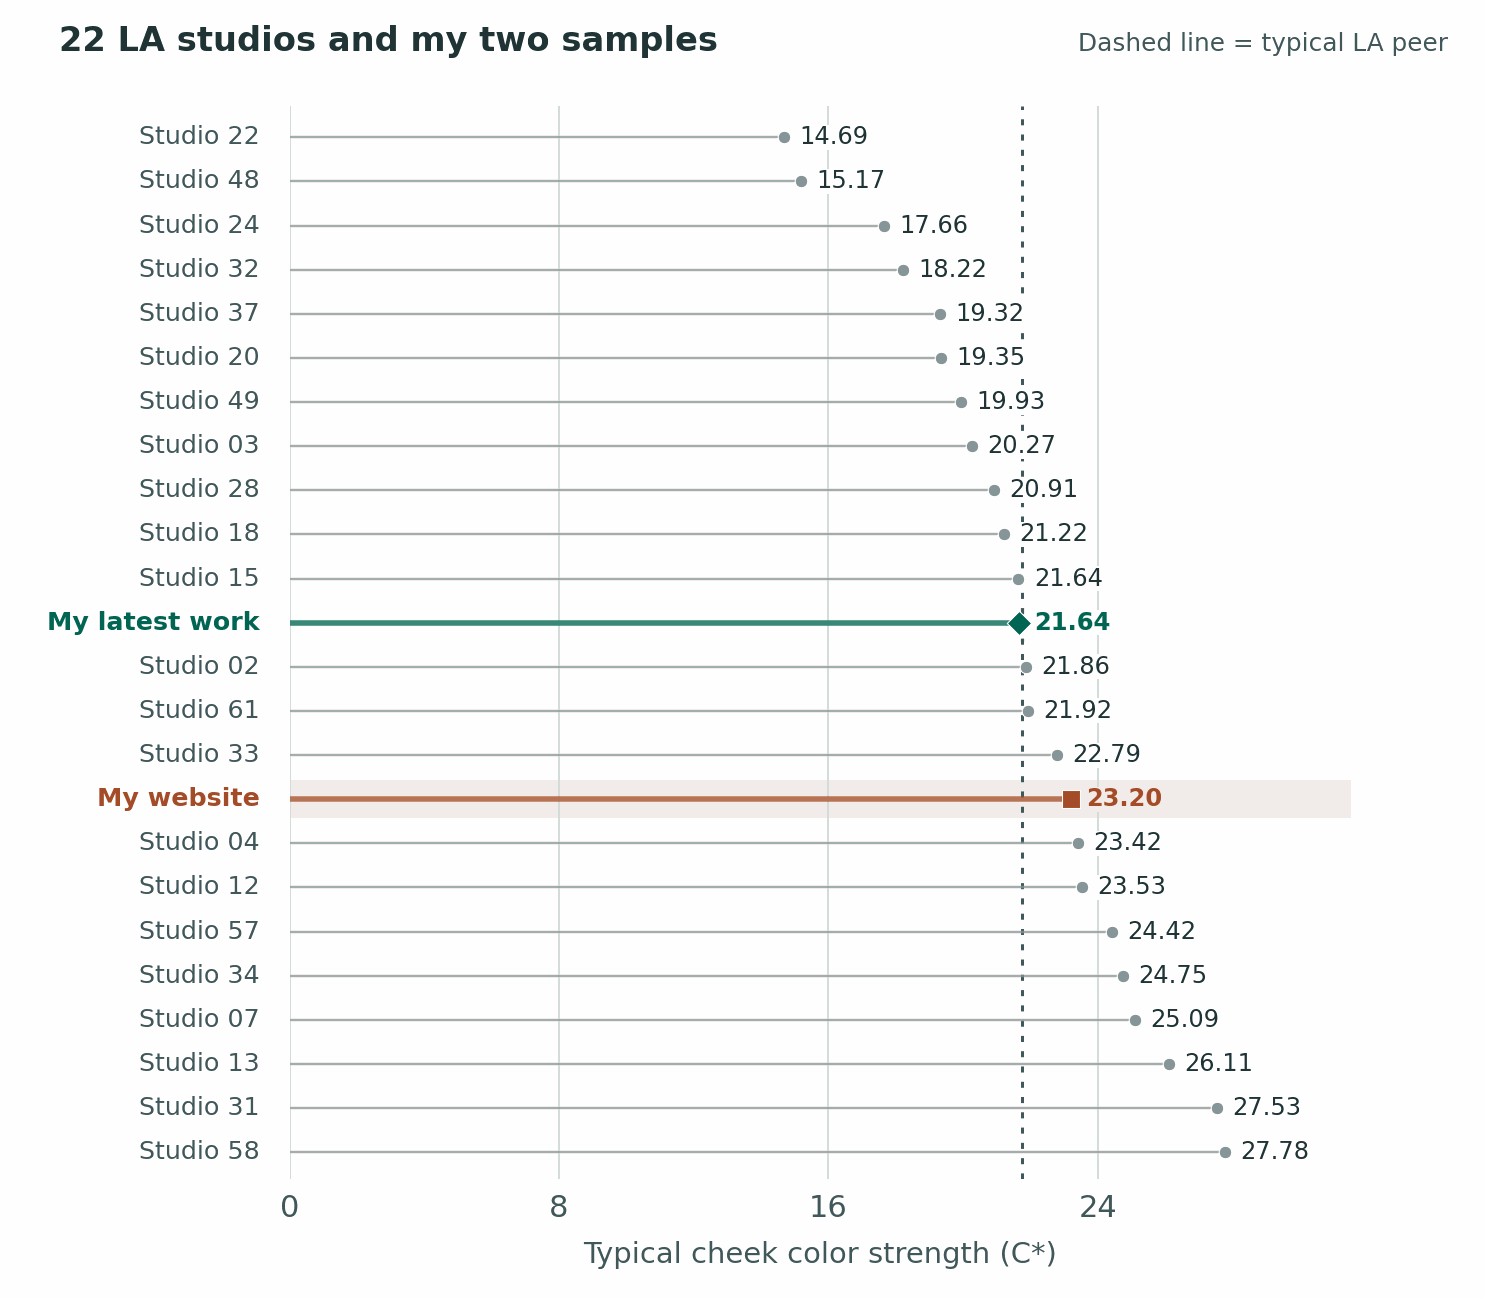
The points for my latest work (21.64) and the LA midpoint (21.75) almost sit on top of each other. My website at 23.20 had a little more color on a typical cheek. So the early work’s unusual consistency came at a level of color strength other photographers use all the time.
One face, two very different questions
So far I’ve been moving from actor to actor. Now stay on one face. On my website, the typical difference in hue between left and right cheeks was 3.49°, against 2.72° in LA. One of my actors’ cheeks tended to lean a little further toward pink or gold relative to the other. That put the website seventeenth of 23 when ordered from the smallest gap up. Yet my gaps themselves had the narrowest spread, just 1.32° across the middle half. I could give somebody a slightly bigger difference between cheeks and do it with remarkable dependability. Consistently below average, if you like.
There’s a very good reason for this: I usually have at least three lights on the actor at once. A lot of the LA headshots I compared look to me as though one light does most of the work. When a few lights reach a face, turning your chin a little changes the mix on each cheek. I suspect that helps explain some of the shifts I see. Every strobe has a little color variation built in, they also bounce off of surfaces in the studio.
That’s why I was pleased with 1.20° in my latest work, as you’ll see below. The pink-to-gold difference between my actor’s two cheeks was less than half the typical LA gap of 2.72°. New York measured 2.57° and London 3.28°. On that test my latest work came first against LA, second against New York, first against London and second overall. The strength of the color still differed by 3.77 C* between cheeks, close to the full group’s 3.56 and 34th of 62. In other words, one cheek could have a stronger flush while both stayed much the same shade. I’m very curious what’s causing that and it’s something that can be improved.
Inside a single portrait, one cheek sat 17.17 lightness units below the other while its hue moved just 0.66°. In another, an 11.50-unit brightness drop came with 0.07° in hue change. That’s a face with a visible shadow and almost no shift along the color wheel. A photograph can have plenty of shape and still earn a tiny hue number.
Four portraits in my latest work had a gap of at least ten lightness units between cheeks. That gave me four faces with a substantial shadow to inspect. Their typical hue shift was 0.36°, alongside 3.77° for the 119 qualifying LA peer images. Four cases give me something to look at closely. They leave plenty to learn about what the next four faces might do.
OBSERVATION:
Cheek-to-cheek hue variance here can also mean that the photographer isn’t adding a big color grade to the image. For example, they’re not adding blue, green or red into the shadows or highlights for their look. Whether this is good or not really depends on your own preference. Do you prefer a natural, true-to-life look or a heavily graded look? That will really depend from person to person. In my rankings at the end, I put less stock into this.
The difference across a single face
For each portrait I took the distance in hue between its two cheeks, then found each portfolio’s middle reading. Small numbers mean the cheeks usually landed in much the same place on that pink-to-gold scale. This chart can’t tell you which cheek was pinker. It records how far apart they were.
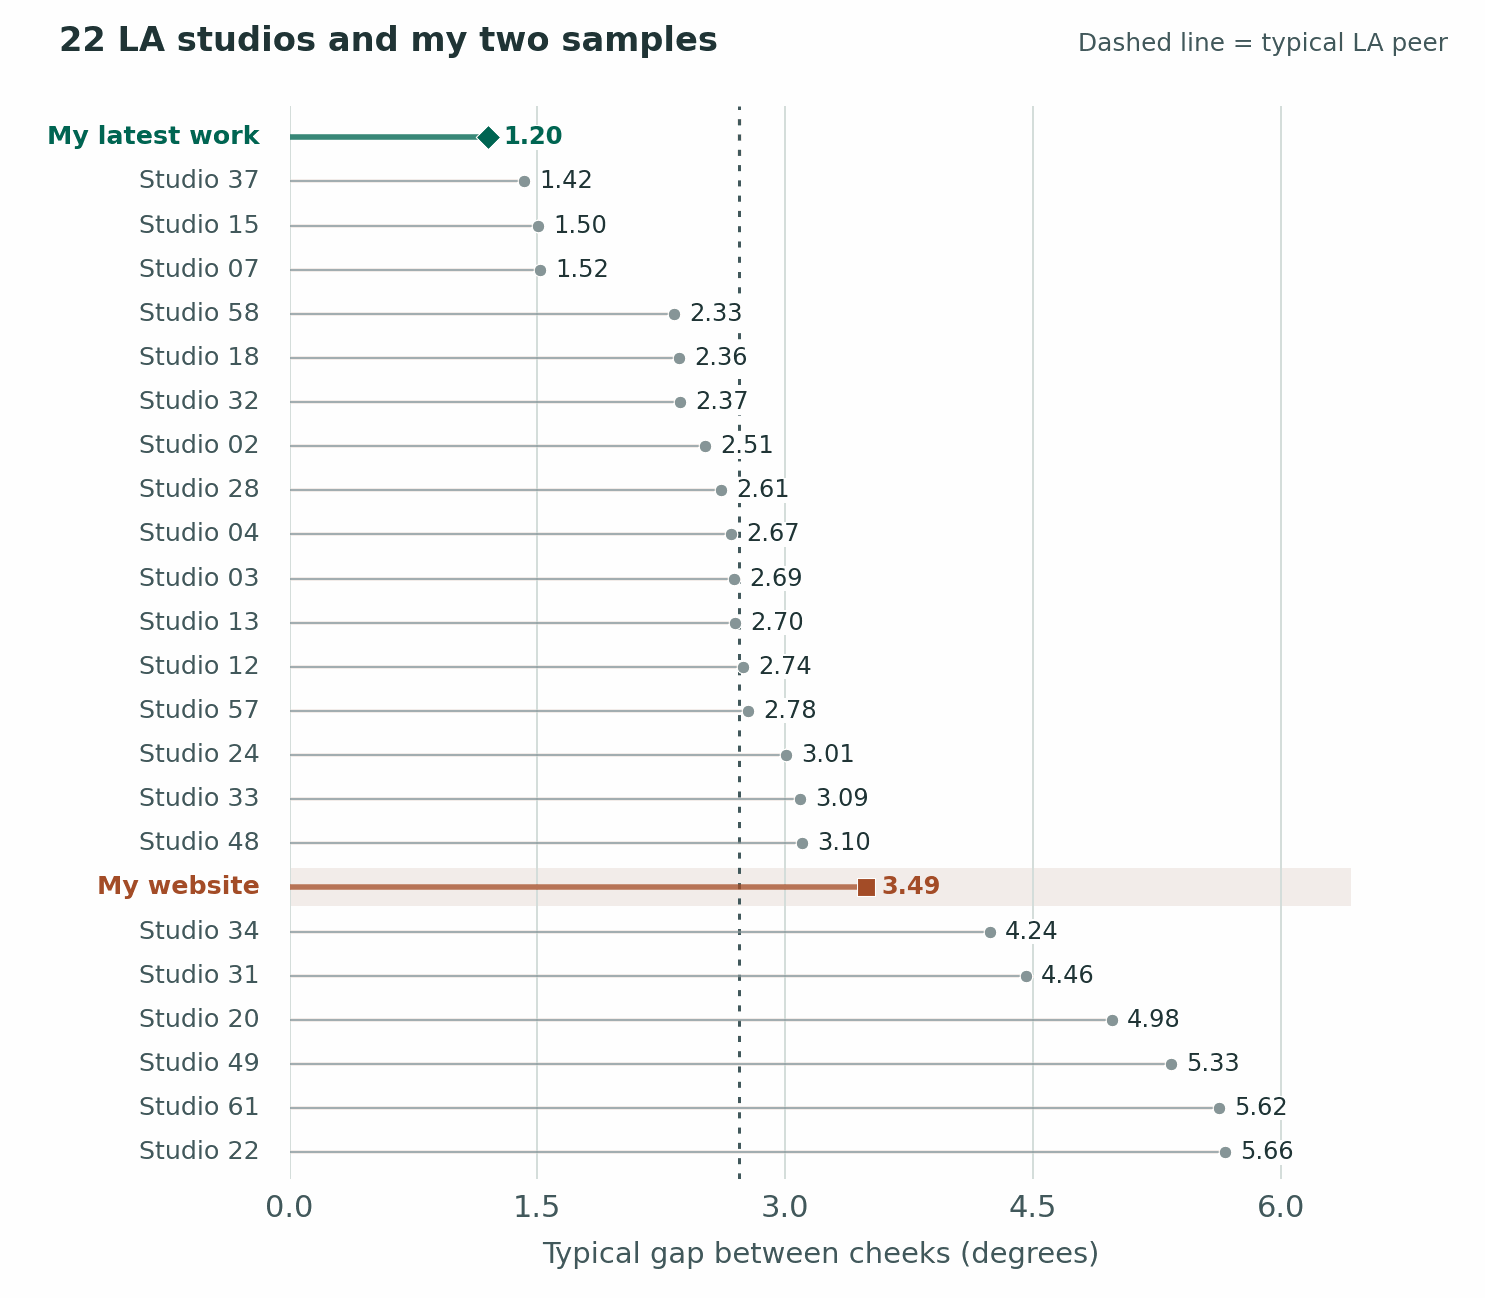
My latest work had the narrowest typical LA gap at 1.20°. The nearest LA peer was at 1.42°. Widening the comparison uncovered one studio at 1.18°, effectively right beside me. That seems more interesting than a medal. My result is at the tight end of the group, even with the three or more lights I generally have reaching an actor. I’m happy to leave two hundredths of a degree out of any argument about taste.
Observation:
This makes sense- my website portfolio has a lot of creative edits and difference types of styles where my recent work is pure headshots. Again, that’s why there isn’t too much stock on this but it is interesting for those who are repeating a clean, headshot look.
What changed across the cheeks even when hue held
Two cheeks can both look peach while the camera-facing side has a stronger flush. The dots here measure that difference in strength. A lower value means the more vivid cheek and the more muted cheek tended to resemble each other on this one dimension.
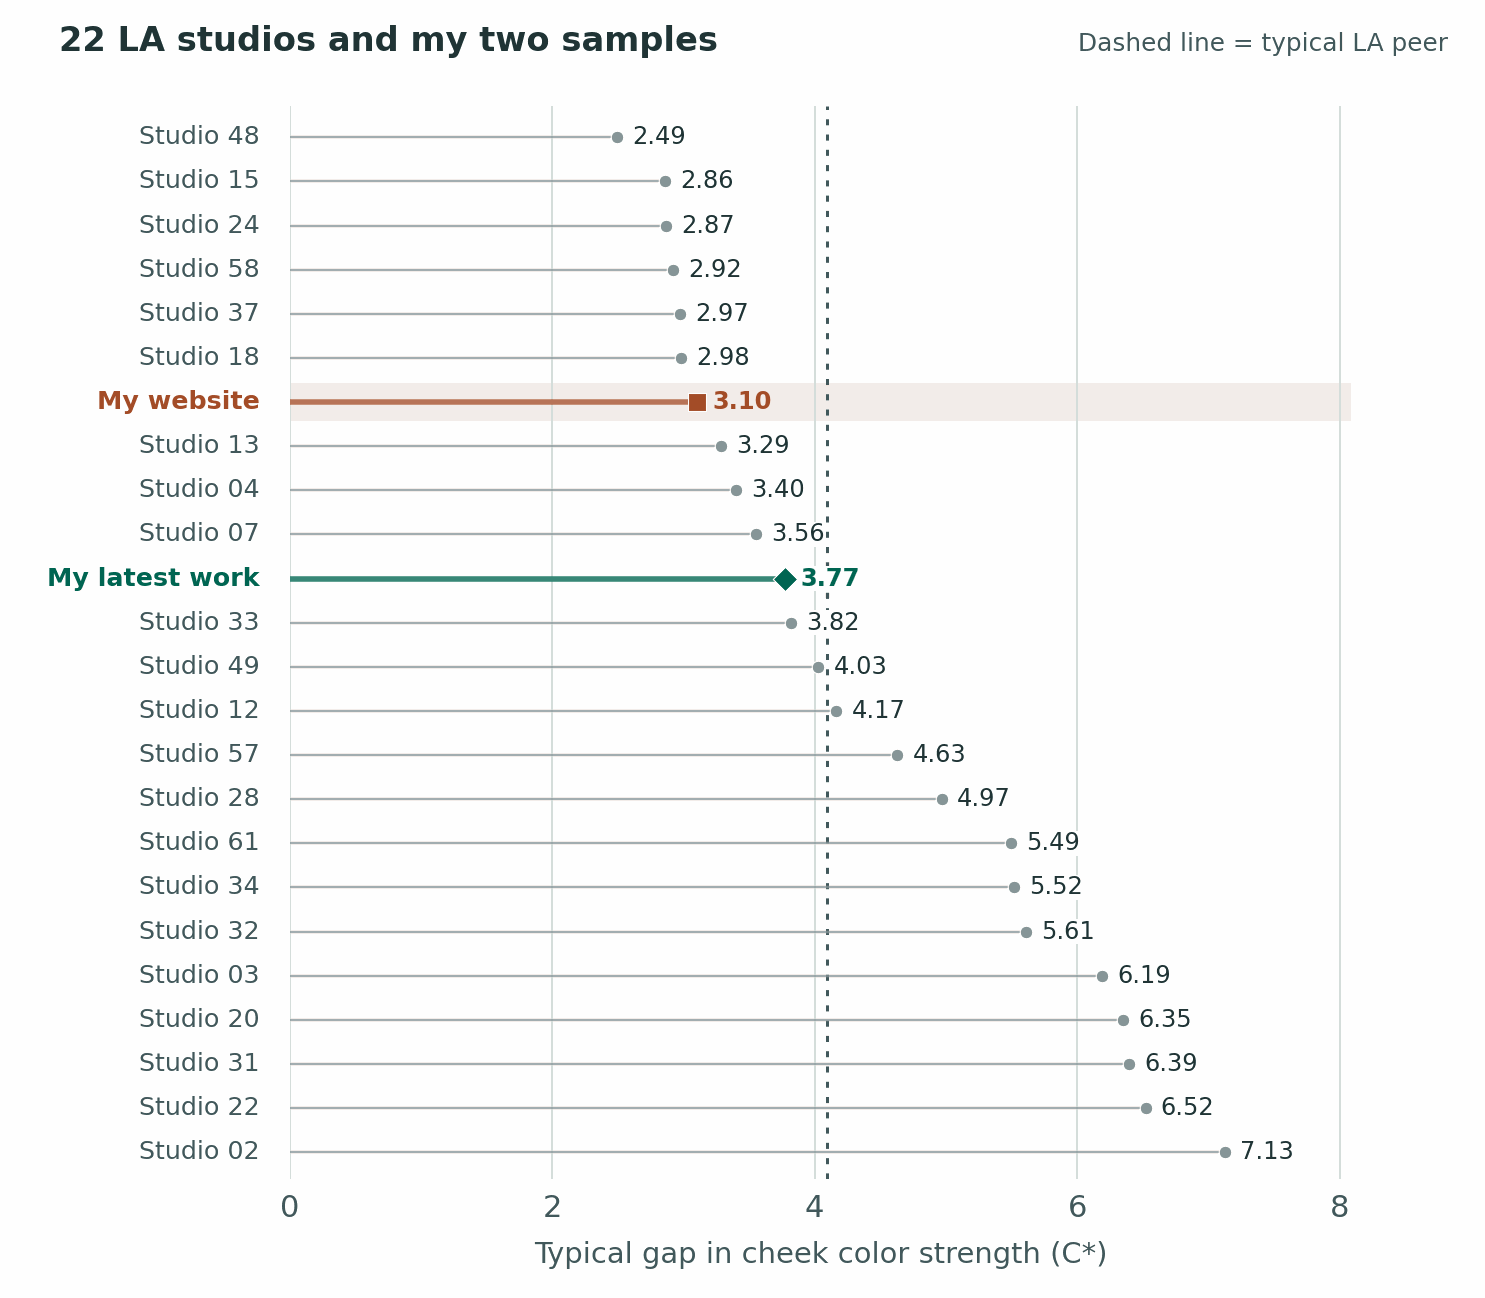
My latest work sits inside the LA group at 3.77 C*. My website comes in a little tighter at 3.10. Across all seven cities my latest work ranked 34th out of 62. That takes some air out of the idea that one side of every face was a color copy of the other. The hue stayed particularly close, and the strength of the color still varied an ordinary amount. A little more blush or a different angle to the light can belong in a good photograph.
Observation:
My latest work being unretouched in the sample really hurts here. Knocking down highlights is a big part of the retouching process. I’m not surprised my older work did better, since that is more curated.
Consistently a little further apart
This was probably the hardest graph to understand. Say nearly every portrait in one portfolio has a three-degree gap between the cheeks. Another gallery alternates between half a degree and six. They can have a similar typical gap, yet the first photographer repeats it much more reliably. That repeatability is what the axis measures here. AKA- the hue shifts that’s present in their setup do not have a lot of wild variation.
Observation:
I’m not sure if I’d put a lot of stock into this or a little. I’m shocked that my website was #1 here too. Remember how I said there was a lot of different editing styles? Somehow the hue gap between cheeks was remarkably similar even between different editing styles. I really don’t know what that means in the bigger picture but that fascinates me.
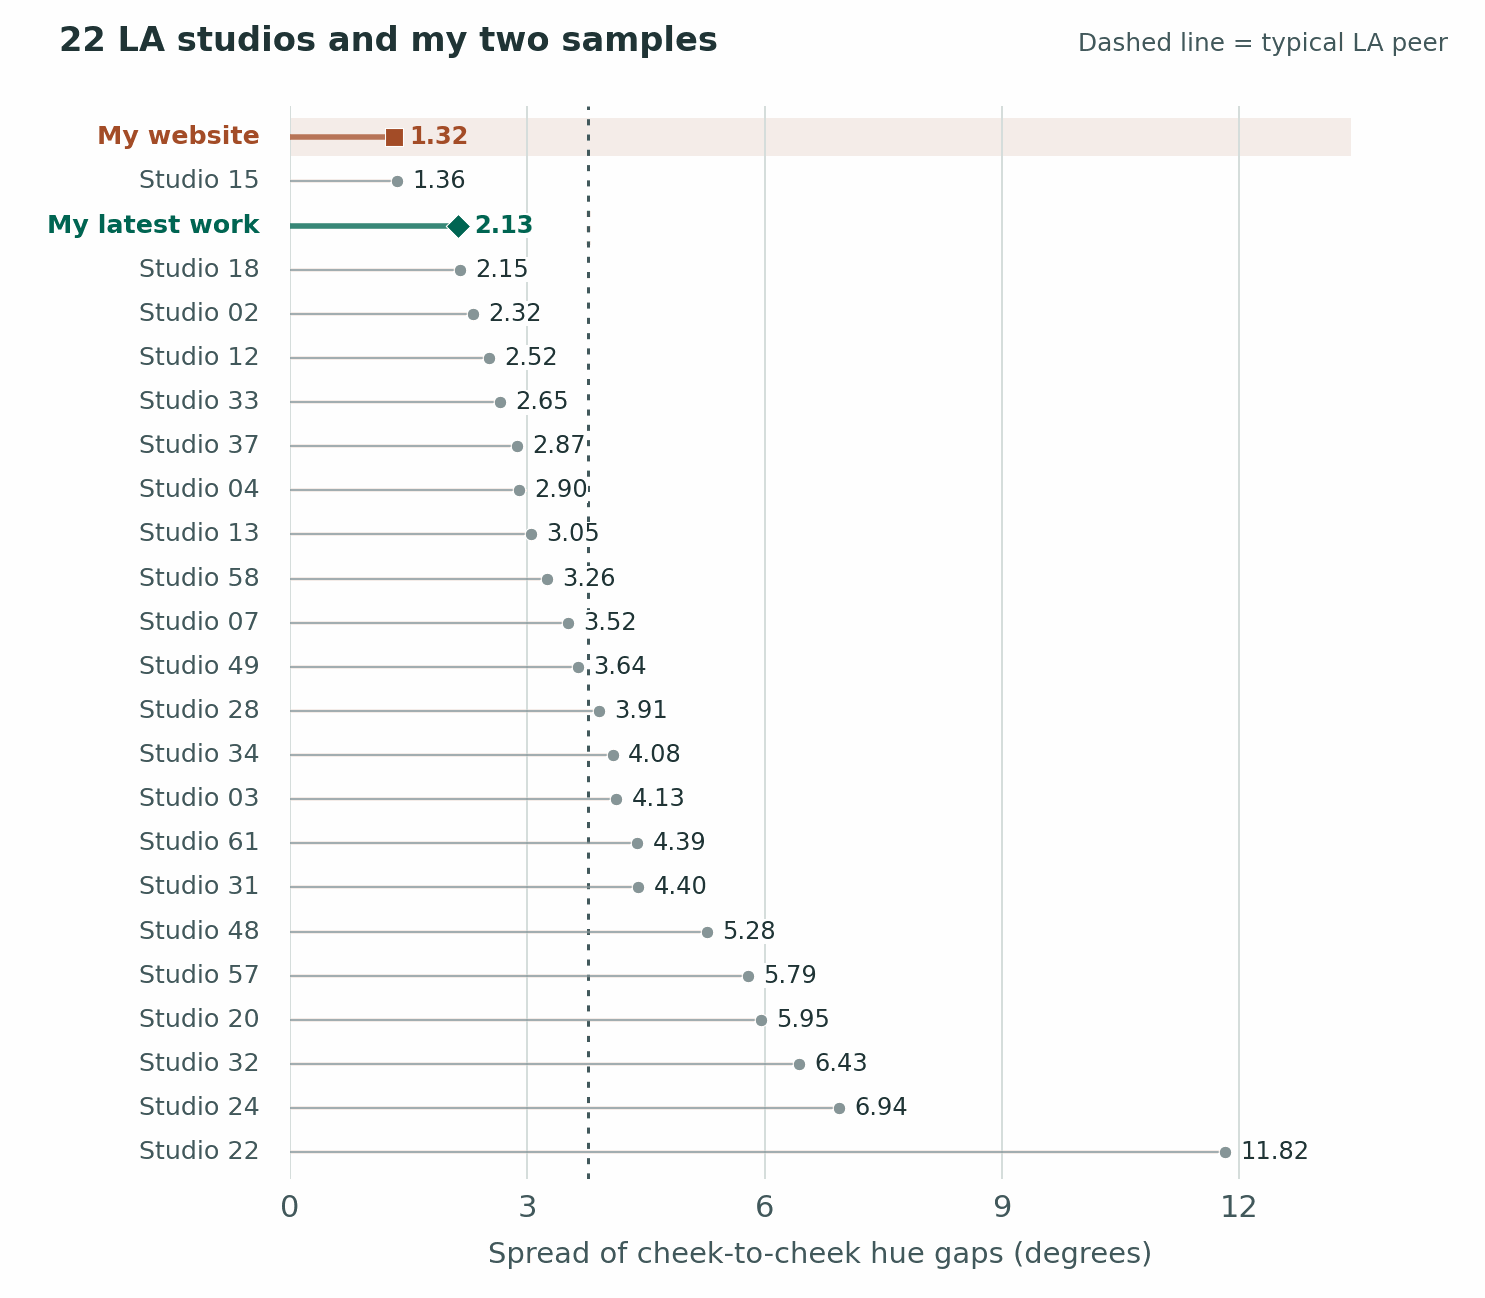
The website’s typical cheek gap was on the wide side at 3.49°. But the gaps in its middle half varied by only 1.32°, the smallest spread among my website and the 22 LA peers. The comparable spread for my latest work was 2.13°, second against those peers. Both facts can be true. My website faces tended to have a little more side-to-side hue difference, and I was unusually consistent about how much.
the blacks
I like detail in a black shirt. If an actor brings in a jacket with a great cut, I’d like to see where the shoulder ends. But saying “your blacks look lifted” could mean the jacket looks gray, or the whole picture lacks a deep shadow. Those are two very different edits. Which part of the picture are we pointing at?
I measured brightness on a scale where 0 is black and 255 is white. In a small patch of black shirt, the darkest tenth of the fabric pixels ended around 26. Including more of the shirt, the reading drops to 21. We’d picked up darker folds. Across the whole picture, the darkest one percent ended at 13.1, what I call the black floor. Think of sorting 100 pixels from dark to light and looking near the very darkest end. The jacket could show texture and there could still be a deeper black elsewhere in the frame.
How dark the deepest shadows looked across pictures
Typical black floor — website (20) 17.03, my latest work 10.25, typical la 7.57.
Black-floor spread — website (20) 14.82, my latest work 6.26, typical la 7.55.
The first row says my latest work generally had a little more light left in the darkest parts than a typical LA portfolio. The second says that choice varied less from shot to shot. The spread in my latest work, 6.26, was close to London’s 6.58. New York’s was 9.66. My website’s 14.82 means you’ll see a wider mix of deep and open shadows there. Wardrobe and backgrounds get a vote in that, too.
Only one portrait in my latest work had a floor of 16 or higher, compared with 71 of 351 LA portraits. That cutoff simply flags frames where even the deepest tones stay relatively light. It’s an odd little result until you picture two galleries. One can usually have darker blacks and still include more high-key pictures where the whole frame is light.
Observation:
This makes sense- I like the blacks in an image a little softer. It’s more filmic. The black-floor spread shows how consistent a photographer hits their own blacks. Not surprised that my website did poorly there- I’ve been back and forth on this over the years. New monitors I’ve gotten also have allowed my to hit the perfect black levels way more consistently, and that only shows in my latest work.
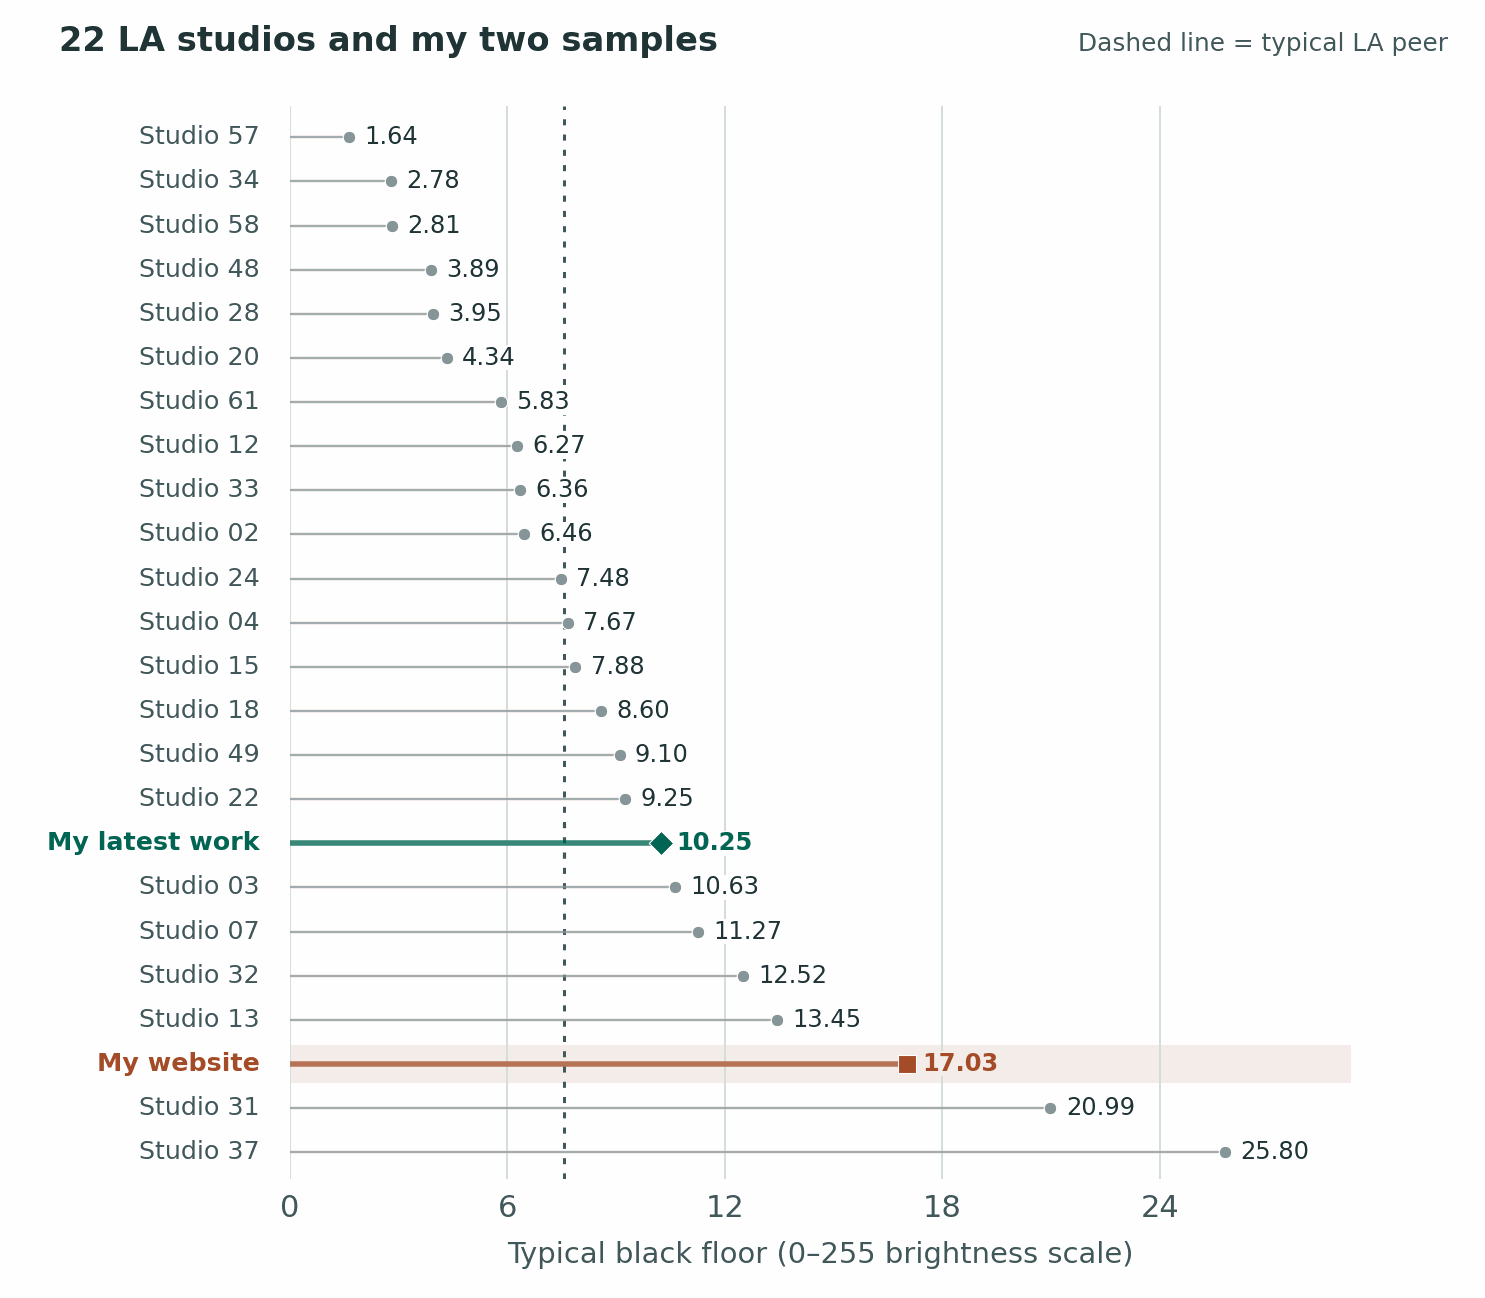
My website’s 17.03 sits toward the lighter end. My latest work, at 10.25, gets closer to the LA midpoint of 7.57. In these pictures I usually left some room to see into the dark parts. Whether that works depends on the portrait. If the jacket is supposed to disappear against the background, getting to admire every seam might defeat the whole idea.
Did the shadow floor jump around
This time a short line means the darkest tones landed at a similar level across different pictures. It doesn’t tell you whether the photographer likes black backgrounds. A studio could use relatively open shadows every time and end up with a short line here.
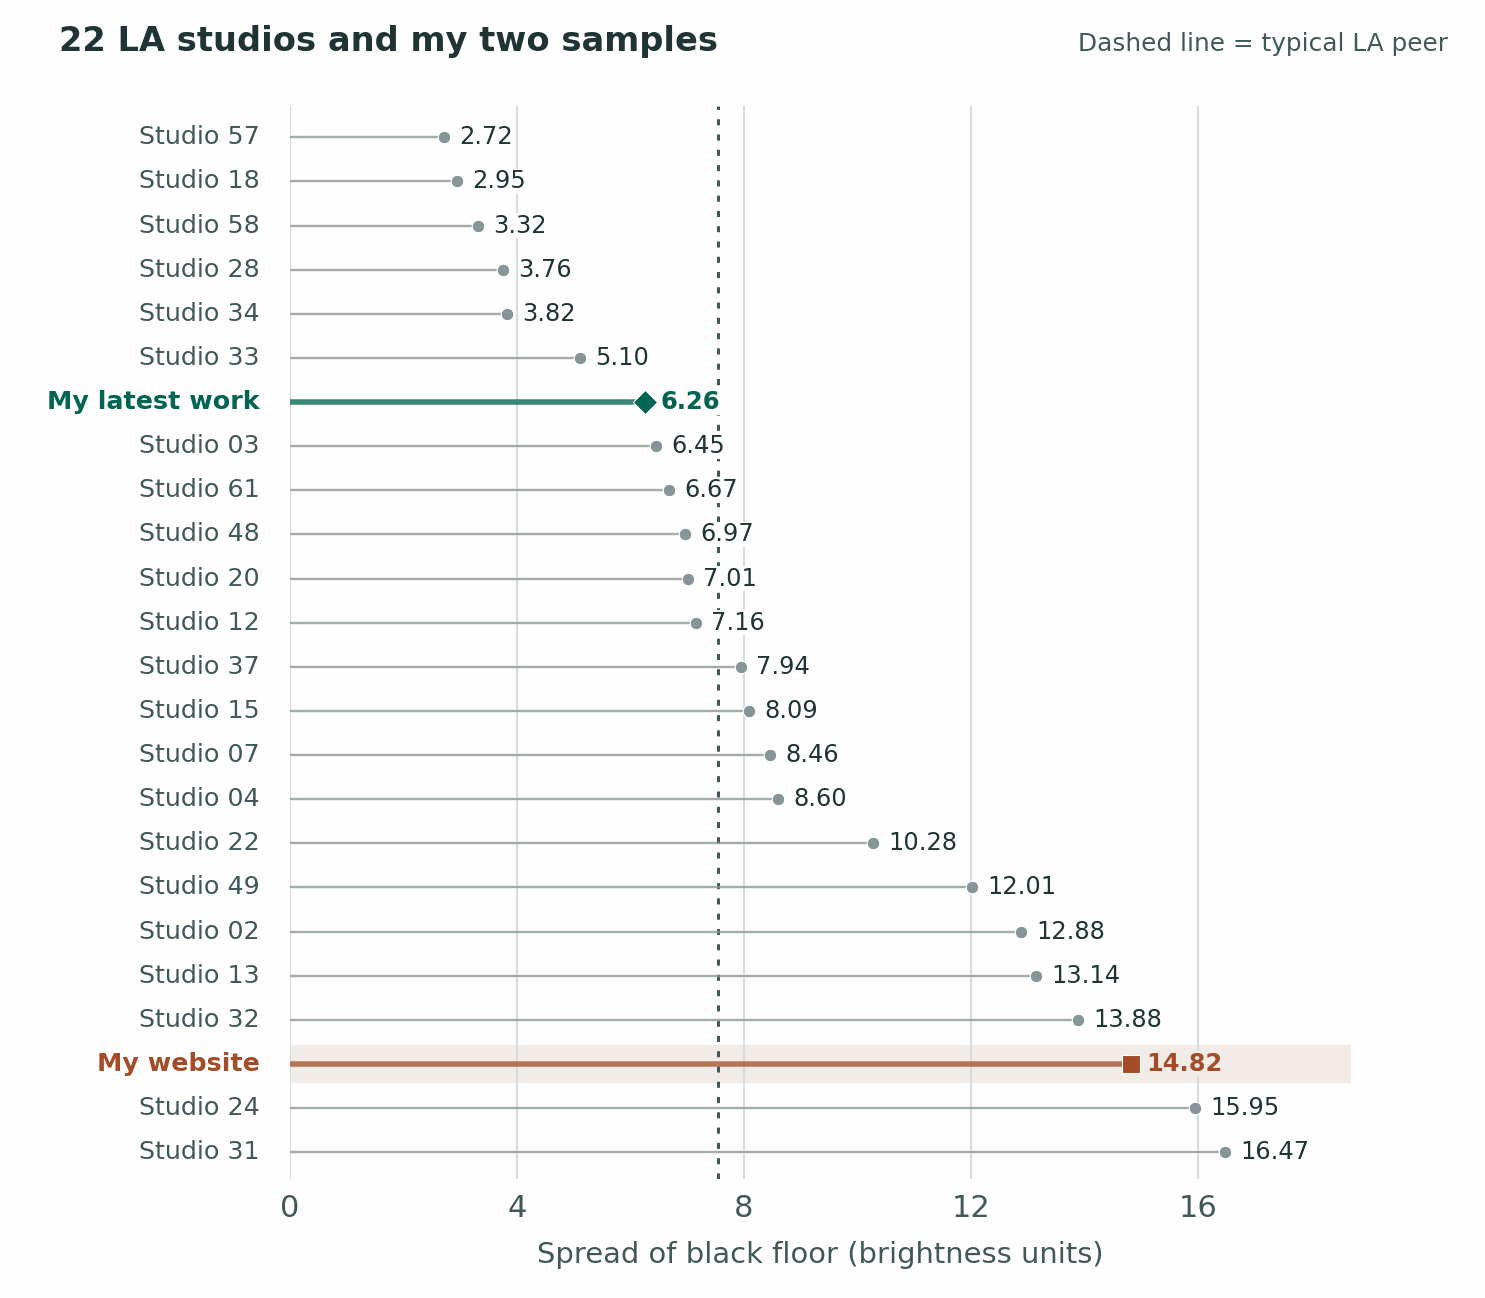
My website’s spread was 14.82 brightness units, near the wide end of the LA group. My latest work measured 6.26, a little tighter than the typical LA spread of 7.55. In practical terms, the website contains a wider variety of deep and open blacks. For two different roles that variety might be useful. For two looks intended to hang together, I’d pay closer attention to a shift like that.
Attempting to rank the color science of all studios
I’m including my scorecard because this is where a narrow measurement can start sounding like a judgment about an entire photographer. This score gives the most weight to consistency across actors. Higher is better under these particular rules. My website and my latest work are each scored against the same peer studios.
For a combined LA score, I gave picture-to-picture hue and chroma 30% each, cheek-to-cheek hue 20%, cheek-to-cheek chroma 10%, and black-floor consistency 10%. Sixty of the 100 possible points came from what happens as an actor scrolls through a gallery. Choosing lighter or darker blacks earned exactly zero. My latest work scored 89.1 and placed first. My website scored 66.8 and placed third. The five highest-scoring peers averaged 69.6. Those are scores for consistency under my chosen weights. Giving extra weight to the weaker color results instead moved my latest work to second. It’s worth knowing who wrote the scorecard. I did. For safekeeping, I moved the weighting of these rankings to different amounts. I still came in the same position; my website moved up in most of the other ones,
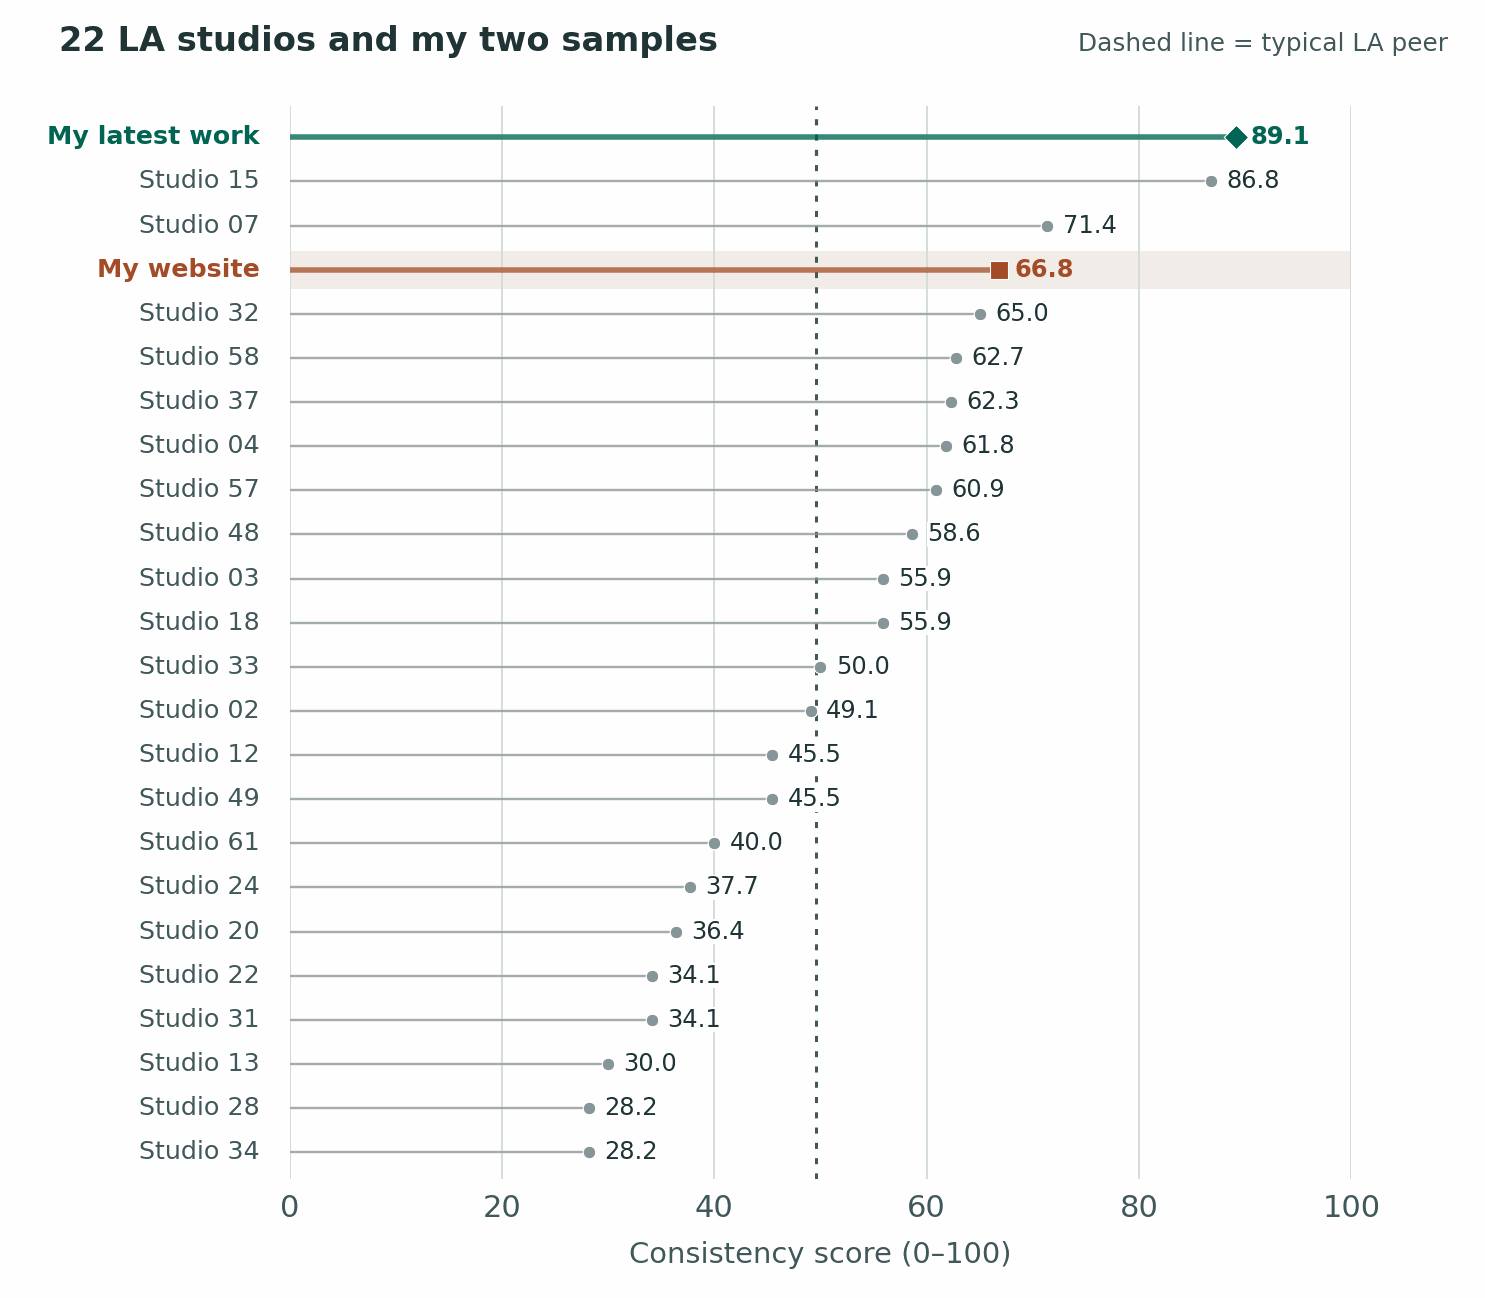
My latest work came in at 89.1. The leading peer scored 86.8. My site scored 66.8, close to the top five peers’ average of 69.6. These numbers describe a specific set of habits the measurements reward. If the expression in the third-place portrait makes you want to meet the actor, pick that portrait. There are precisely zero points in my scorecard for making you curious about somebody.
Can you measure how harsh a headshot looks?
Look at the shadow beside somebody’s nose. Does the shadow start with a sharp line you could trace with a pencil, or can you follow a gradual fade from light to dark? That’s the softness of its edge. Now look into the shadow itself. How dark did it get? That’s its depth. A shadow can get quite dark and take its sweet time getting there.
For this separate check, I went back to 61 published pictures from my theatrical gallery and 256 from six LA studios. Only 18 of mine and 65 of theirs had a nose-shadow edge clear enough to measure. I used the distance between the eyes as a ruler. Otherwise, cropping closer to the same face would make its shadow look wider on paper.
What the measurable nose shadows looked like
Width of the fading edge, relative to eye spacing — my 18 portraits 7.57%, 65 peer portraits 7.40%.
Depth from light into shadow — my 18 portraits 1.71 stops, 65 peer portraits 1.61 stops.
Here’s how to read that first row. If the eyes were 100 pixels apart, the transition from light to shadow would run a little over seven and a half pixels on my typical face and about seven and two-fifths on theirs. A bigger percentage means a wider fade and therefore a softer edge. These two are close. In the second row, one stop down means half as much light, and two stops down means a quarter. Both groups fell between those marks. My measurable shadows typically went a touch darker.
Matching eighteen of my portraits to similar peer portraits gave my edges a typical extra 0.46 percentage points of width, and my shadows 0.16 stops more depth. Even alongside a similar face angle and shadow direction, my shadows tended to come in a little more gradually and finish a little darker. That is entirely possible in the same picture.
Interpretation:
When I utilize shadows, they run a little darker than average BUT the softness of the light creating that shadow is also a little softer than average. This is a great result to me- I’m able to get good dramatic shots with a nice touch; my lighting is not using brute force to do it.
Why I shoot three days a week
If you’ve ever looked at my calendar and wondered why I shoot three days a week, this is a big part of the answer. Keeping somebody’s skin looking like real skin over the hundreds of edited photos that I send them takes A LOT of attention and energy, and I have a finite supply. I can put that kind of concentration into three days of shooting. I want the last actor who comes in on the third day to get the same eye I brought to the first one.
The hard part is often deciding whether to do anything. One person sits down with naturally rosy cheeks. The next person has a more golden complexion. After I’ve looked at that first face long enough, the second can strike me as unusually yellow. It takes brain power to remember that the person I saw an hour ago has absolutely no say in the color of the person in front of me now. That is exactly where I feel the learning curve with the new work.
Leaving myself time for retouches is part of the same decision. Rushing a retouch costs me twice. I have to judge the picture, and at the same time I’m thinking about how fast I can finish judging it. If a patch of color catches my eye, I want enough attention left to ask whether it’s makeup, the way the skin catches the light, or a perfectly ordinary bit of that person’s face.
That matters to the next person whose file I open, too. In my experience, leaving enough time for retouching preserves the brain power I rely on to see each actor afresh. It’s easy to do one careful portrait when everything else can wait. The work is being able to do it again for somebody else without the first person’s face still setting the terms.
The study measured pictures. It didn’t compare a three-day shooting week with a five-day one, or retouches made on a deadline with retouches made at my preferred pace.
I think you really see the benefit of my schedule in the consistency of the work I deliver. In every consistency metric I’m ranking and performing extremely well. What I think is incredible is that I have random, unretouched work up against some the best portfolio work of fellow peers.
What I’d want an actor to take from this
Before I photographed actors in Los Angeles, I worked casino surveillance in Atlantic City. At three in the morning I might be looking for the second somebody’s hand went into somebody else’s pocket, on grainy video with a few hundred people in the frame over hours of footage- not even knowing what the victim even looks like sometimes. You learn to pick a place to look. Years later I find myself doing exactly that with skin tones. An absolutely insane attention to detail was forged into my brain at a young age and it’s still there.
As stated- nine of the ten portraits in my latest work were unretouched. Taking out the retouched picture left a chroma spread of 1.93 C*, still tighter than every peer portfolio. One actor appeared twice and came in with makeup by an artist outside my studio’s approved list. Blush can land right where I’m measuring. Counting her once gave 1.85 with one look or 1.93 with the other. Either way, I got much the same answer about color strength. The repeat actor didn’t explain the result. I couldn’t isolate what the makeup contributed.
My files carried differences a retoucher could even out. Public galleries also get an extra round of selection. On the other hand, cheek lightness in my latest work ran from about 71 to 87 L* on that black-to-white scale. The LA photos spanned 40 to 98. Their sample included cheeks that photographed much darker and much lighter. That’s a wider range for a portfolio to cover. These are readings from photographs, where exposure matters. They can’t tell you the mix of actual complexions in either studio.
This next part blew my mind: To see what choosing only ten might do, I compared my latest work with 171,171 possible ten-picture selections from the LA portfolios. After weighting the studios equally, 99.6% of the selections varied more in color strength. My tight result was unusual even when the other photographer only had to put ten pictures on the table. Those groups borrow pictures from each other. They aren’t 171,171 independent shoots or a prediction about my next client.
For an actor, here’s the part I care about. Say you pick one headshot for the role where everybody trusts you and another for the role where that would be a terrible idea. I want the two pictures to say very different things. I’d also like the person who opens the audition-room door to look familiar in both of them. That was the reason for worrying about the monitors in the first place. It’s still the reason I care where the color lands.